-
Home
-
China Data
- China Import and Export Data
- China Statistics Import and Export Data(CSD) China Trade Flow Import and Export Data(CTF) China Total Import and Export Data(CTD)
- China Trade Research Monthly Report(CTRMR) China Trade Research Custom-made Report(CTRCR) China Trade Research Yearly Report(CTRYR) China HS Code
-
USA & Canada Data
- USA & Canada Import and Export Data
- US Bills Export Data(USBED) US Statistics Export Data(USSED) US Trade Flow Import and Export Data(USTF) US Total Import and Export Data(USTD) Canada Importers and Exporters(CAIE)
- US Bills Import Data(USBID) US Statistics Import Data(USSID) US Importers and Exporters(USIE) Canada Trade Flow Data (CATF) Canada Total Import and Export Data(CATD)
-
Asia Data
- Asia Import and Export Data
- Indonesia Kazakhstan Sri Lanka Malaysia Philippines Afghanistan
- India South Korea Japan Thailand Jordan Taiwan & Hongkong & Macao
-
Vietnam
Pakistan
Singapore
Turkey
 Uzbekistan
Other Asia Countries
Uzbekistan
Other Asia Countries
-
Latin America Data
-
Europe & Africa & Oceania Data
- Europe & Africa & Oceania Import and Export Data
- Russia UK Georgia Norway Egypt Australia Samoa
- EU 28 Countries Moldova Azerbaijan Switzerland Botswana New zealand French Polynesia
- Ukraine Spain Belarus South Africa Morocco Fiji Other Countries
-
Market Research
-
Products
 China Data
- USA & Canada Data
- Asia Import and Export Data
- Latin America Data
- Europe & Africa & Oceania Data
- Company & Market Research
-
China Statistics Data(CSD)
China Trade Flow (CTF)
China Total Data(CTD)
China Trade Monthly Report
China Trade Yearly Report
China Trade Custom Report
China HS Code
-
US Bills Export Data(USBED)
US Bills Import Data(USBID)
US Statistics Export Data(USSED)
US Statistics Import Data(USSID)
US Trade Flow (USTF)
US Importers and Exporters(USIE)
US Total Data(USTD)
Canada Trade Flow (CATF)
Canada Importers and Exporters
Canada Total Data(CATD)
-
Indonesia
India
Vietnam
Kazakhstan
South Korea
Pakistan
Sri Lanka
Japan
Singapore
Malaysia
Thailand
Turkey
Philippines
Jordan
Uzbekistan
Afghanistan
Taiwan & Hongkong & Macao
Other Asia Countries
-
Mexico
Brazil
Venezuela
Costa Rica
Bolivia
Honduras
Argentina
Chile
Peru
Colombia
Uruguay
Paraguay
Panama
Ecuador
Nicaragua
EL Salvador
Guatemala
Other Latin America Countries
-
Russia
EU 28 Countries
Ukraine
UK
Moldova
Spain
Georgia
Azerbaijan
Belarus
Norway
Switzerland
South Africa
Egypt
Botswana
Morocco
Australia
New zealand
Fiji
Samoa
French Polynesia
Other Countries
-
Trade Tools
-
About US
-
Contact US

News
2025 Optical Fiber Import Report
03:02 29 / 09 / 2026
Executive Summary
In 2025, the U.S. optical fiber and cable import market maintained robust growth, driven by the explosive demand from AI data center construction and the rollout of 800G/1.6T high-speed interconnection infrastructure. Based on full-year customs data, the total import value of related products exceeded USD 9.13 billion, with a year-on-year growth rate of over 38%.
The market exhibits a high concentration pattern: the top 5 supplying economies account for 73.8% of the total import value, while the remaining demand is scattered across more than 60 countries and regions.
Canada, India, and China remain the core supply sources, while Southeast Asia and Europe are emerging as fast-growing supplementary bases. This report analyzes import trends, regional supply structures, and key market opportunities to support global suppliers in developing targeted U.S. market entry strategies.
Core Market Drivers & Demand Structure
1. Key Growth Drivers
The strong growth of U.S. optical fiber imports in 2025 is fueled by three main factors:
a. AI Data Center Expansion:Large-scale deployment of next-generation data centers and high-performance computing clusters has significantly boosted demand for high-fiber-count, low-loss, and high-density optical cables.
b. High-Speed Network Upgrades: The commercialization of 800G/1.6T optical modules has accelerated the adoption of advanced cabling solutions, driving growth in high-value-added products.
c. Broadband & Enterprise Network Construction: Government-backed FTTH programs and enterprise private line upgrades provide stable, long-term basic demand.
2. Monthly Import Trend Analysis (Value & Volume)
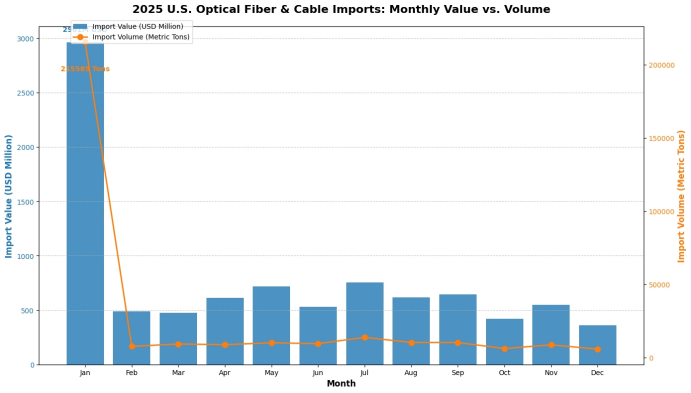
The combined bar-line chart below illustrates the monthly import performance in 2025:
·Blue Bars: Monthly import value
·Orange Line: Monthly import volume
Key Observations:
January: The annual peak in import value (USD 2.96B) with high volume, indicating concentrated delivery of large-scale high-end orders.
April: The annual peak in volume (335,190 units) but only the 6th highest in value, reflecting a surge in low-unit-price standard product procurement.
July: The second-highest import value (USD 754M) with medium-high volume, showing balanced demand for both high-end and conventional products.
Q4 Slowdown: Value and volume decline in October-December, corresponding to the traditional project off-season.
3. Regional Supply Structure & Key Markets
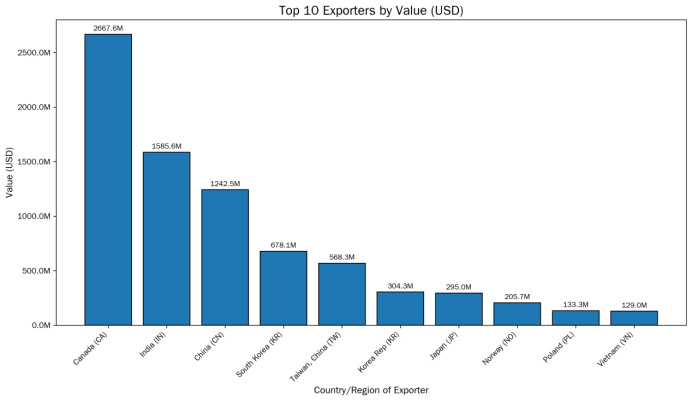
The U.S. import supply chain is multi-layered, with clear regional division of labor. The top 10 exporting economies are as follows:
Tiered Supply Pattern:
·First Tier (Value Leaders): Canada, India, and China dominate high-value segments, supported by strong data center product capabilities and scale advantages.
·Second Tier (Mid-Range Players): South Korea, Taiwan (China), and Japan excel in advanced components and high-density cabling solutions.
·Third Tier (Emerging Markets): Vietnam, Poland, and Germany are growing rapidly, leveraging cost advantages and regional trade agreements for standard and niche products.
4. Strategic Recommendations for Market Entry
For global suppliers targeting the U.S. market, we recommend the following strategies:
1.Optimize Product Mix
Prioritize high-fiber-count, low-loss, and data center-grade optical cables to capture the high-value segment.
Maintain cost competitiveness in standard products to cover basic telecom and broadband demand.
2.Align with Import Cycles
Ramp up production for January and July to meet peak high-value order demand.
Strengthen capacity for April’s high-volume standard product orders.
Use Q4 off-season to build inventory and negotiate long-term contracts with U.S. importers.
3. Leverage Regional Advantages
East Asian suppliers: Focus on scale, technology, and delivery speed for both high-end and standard products.
Southeast Asian/European suppliers: Target short-cycle, mid-value orders and niche applications (e.g., special environment cables).
4. Strengthen Compliance & Certification
Complete UL, RoHS, and other U.S. industry certifications in advance.
Establish clear supply chain traceability to meet U.S. procurement audit requirements.
Conclusion & Outlook
Driven by AI infrastructure investment, the U.S. optical fiber and cable import market has grown to over USD 9 billion in 2025, with a clear structure of high concentration and regional division of labor. The divergence between monthly value and volume reflects the coexistence of high-end and conventional demand segments.
Looking ahead, the continuous expansion of AI data centers and the adoption of next-generation optical interconnection technologies will sustain market growth. Global suppliers can capture stable market share by aligning product positioning, regional advantages, and import cycles with the U.S. market’s unique dynamics.