-
Home
-
China Data
- China Import and Export Data
- China Statistics Import and Export Data(CSD) China Trade Flow Import and Export Data(CTF) China Total Import and Export Data(CTD)
- China Trade Research Monthly Report(CTRMR) China Trade Research Custom-made Report(CTRCR) China Trade Research Yearly Report(CTRYR) China HS Code
-
USA & Canada Data
- USA & Canada Import and Export Data
- US Bills Export Data(USBED) US Statistics Export Data(USSED) US Trade Flow Import and Export Data(USTF) US Total Import and Export Data(USTD) Canada Importers and Exporters(CAIE)
- US Bills Import Data(USBID) US Statistics Import Data(USSID) US Importers and Exporters(USIE) Canada Trade Flow Data (CATF) Canada Total Import and Export Data(CATD)
-
Asia Data
- Asia Import and Export Data
- Indonesia Kazakhstan Sri Lanka Malaysia Philippines Afghanistan
- India South Korea Japan Thailand Jordan Taiwan & Hongkong & Macao
-
Vietnam
Pakistan
Singapore
Turkey
 Uzbekistan
Other Asia Countries
Uzbekistan
Other Asia Countries
-
Latin America Data
-
Europe & Africa & Oceania Data
- Europe & Africa & Oceania Import and Export Data
- Russia UK Georgia Norway Egypt Australia Samoa
- EU 28 Countries Moldova Azerbaijan Switzerland Botswana New zealand French Polynesia
- Ukraine Spain Belarus South Africa Morocco Fiji Other Countries
-
Market Research
-
Products
 China Data
- USA & Canada Data
- Asia Import and Export Data
- Latin America Data
- Europe & Africa & Oceania Data
- Company & Market Research
-
China Statistics Data(CSD)
China Trade Flow (CTF)
China Total Data(CTD)
China Trade Monthly Report
China Trade Yearly Report
China Trade Custom Report
China HS Code
-
US Bills Export Data(USBED)
US Bills Import Data(USBID)
US Statistics Export Data(USSED)
US Statistics Import Data(USSID)
US Trade Flow (USTF)
US Importers and Exporters(USIE)
US Total Data(USTD)
Canada Trade Flow (CATF)
Canada Importers and Exporters
Canada Total Data(CATD)
-
Indonesia
India
Vietnam
Kazakhstan
South Korea
Pakistan
Sri Lanka
Japan
Singapore
Malaysia
Thailand
Turkey
Philippines
Jordan
Uzbekistan
Afghanistan
Taiwan & Hongkong & Macao
Other Asia Countries
-
Mexico
Brazil
Venezuela
Costa Rica
Bolivia
Honduras
Argentina
Chile
Peru
Colombia
Uruguay
Paraguay
Panama
Ecuador
Nicaragua
EL Salvador
Guatemala
Other Latin America Countries
-
Russia
EU 28 Countries
Ukraine
UK
Moldova
Spain
Georgia
Azerbaijan
Belarus
Norway
Switzerland
South Africa
Egypt
Botswana
Morocco
Australia
New zealand
Fiji
Samoa
French Polynesia
Other Countries
-
Trade Tools
-
About US
-
Contact US

News
Germany Pesticide Export Analysis Report
04:37 29 / 09 / 2026
Germany Pesticide Export Analysis Report (HS Code 29331990) – 2025
Germany continues to hold a premier position as a global leader in the agrochemical export market. In 2025, products under HS Code 29331990 (primarily covering heterocyclic pesticide and fungicide compounds) demonstrated strong global export momentum. The annual export value reached USD 779.22 million, with a total export volume exceeding 34,000 metric tons, reaching key agricultural markets worldwide.
Macro Overview
·High Concentration in Top Markets: Brazil, the United States, and Spain collectively accounted for 78.6% of Germany's total global export value for this HS code, with Brazil leading at 43.8%.
·Diversified Global Demand: Beyond the top three destinations, markets such as France, India, China, and Australia contributed significant import volumes, reflecting widespread global acceptance of German agrochemical products.
·Simultaneous Growth in Volume and Value: Monthly export volume peaked at 5,411 metric tons (January), while monthly export value topped out at USD 99.47 million (March), showcasing robust global demand for high-efficiency crop protection products.
💡Customs Data Value Point:
By cross-referencing total macro value against volume, stakeholders can quickly calculate the overall average unit price (USD 779.22 million ÷ 34,687 tons ≈ USD 22,464/ton). This benchmark serves as a baseline to evaluate supplier quotes. Offers significantly above this baseline likely indicate high-value patented formulas, while quotes far below should prompt caution regarding quality or compliance risks.
Top 10 Global Import Destinations (2025)
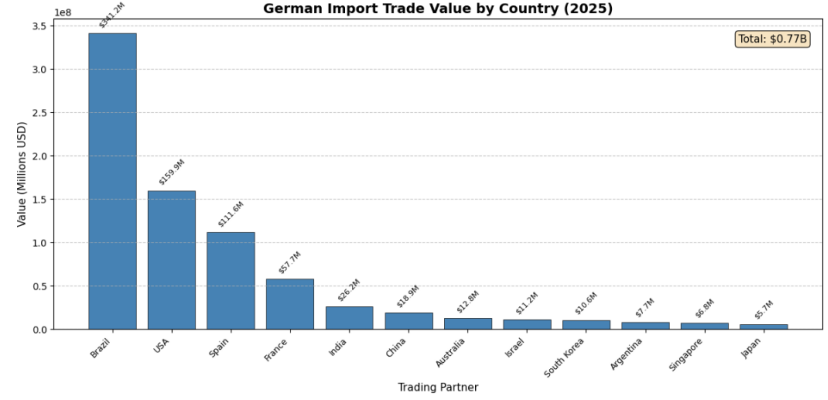
Based on total import value, the top 10 global trading partners for Germany’s 29331990 pesticide products in 2025 are detailed below:
Destination Insights
·Brazil (43.8%): As Germany's largest pesticide export market, Brazil's import value exceeded the combined total of ranks 2 through 4, underscoring Germany's foundational role in Brazilian agriculture.
·United States (20.5%): The second largest market, driven by consistent, high-volume demand for premium, low-residue crop protection solutions.
·Spain (14.3%): Standing as one of Europe’s agricultural heavyweights, Spain acts as a primary gateway for German agrochemicals into Southern Europe.
·Emerging Frontiers: India, China, and Australia combined for roughly 10% of total exports, representing vital, high-growth potential corridors.
💡Customs Data Value Point:
For importers, mapping your own specific procurement unit price against the historical averages of other countries creates a powerful point of leverage. For instance, if your purchase price is significantly higher than the average cost seen in the US market, it may indicate supplier overpricing or prompt a review of product specifications. This horizontal price comparison serves as a vital anchor during contract renegotiations.
Monthly Export Trends (2025)
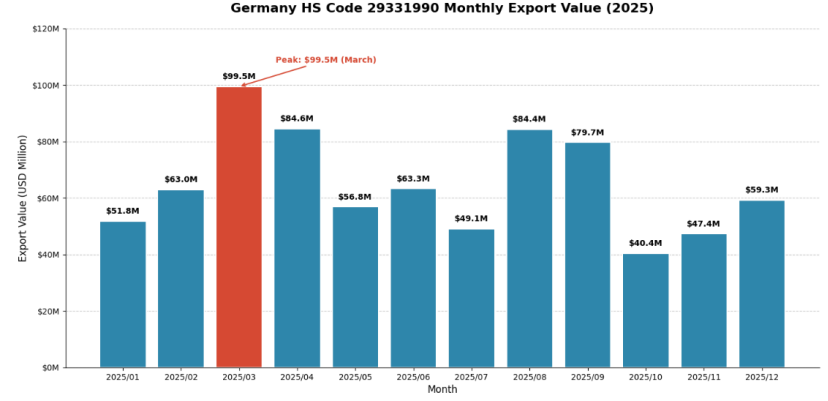
The monthly distribution of German exports reveals distinct fluctuations that closely align with planting and crop treatment cycles across major global agricultural zones.
Monthly Export Performance Metrics
Trend Insights
·Pre-Planting Stockpiling Peaks: Export volumes surged in January (5,411 tons), May (4,945 tons), and July (5,004 tons), matching inventory procurement timelines for the Northern and Southern hemisphere planting windows.
·Year-End Tapering: December volumes plummeted to 329 tons, reflecting typical seasonal inventory depletion and year-end holiday facility closures.
·Value vs. Volume Dichotomy: March volume was modest (1,934 tons), yet it generated the highest monthly export value of the year at USD 99.47 million. This reveals that shipments during this period consisted primarily of high-value patented items or specialized, novel fungicides.
·Seasonal Balance: The first half of the year (H1) commanded 56% of total annual export volume, while the second half (H2) held 44%, showcasing a relatively balanced annual manufacturing rhythm.
💡Customs Data Value Point (Supplier Pricing Analysis):
The Calculated Unit Price column exposes immense monthly pricing volatility: March unit prices spiked to USD 51,437/ton (high-value patented formulations), July unit prices dipped to USD 9,809/ton (bulk, conventional products), and December unit prices hit an anomalous USD 180,121/ton (likely small-batch R&D samples or custom formulations). Commercial Application: Buyers can leverage this timeline to optimize ordering windows. If sourcing highly cost-competitive, high-volume generic products, you should steer clear of high-unit-price months. Conversely, if seeking cutting-edge patented formulations, trace the specific suppliers active during peak-value months to forge long-term technical partnerships.
💡 Customs Data Value Point (Churn Risk & Price Sensitivity):
Radical shifts in monthly unit pricing (e.g., soaring from USD 9,576/ton in January to USD 51,437/ton in March) frequently cause price-sensitive buyers to pause procurement, trim order sizes, or look elsewhere. Tracking monthly customer purchase volumes alongside unit price shifts enables companies to: - Proactively flag customer churn risks early (e.g., following three consecutive months of shrinking order sizes). - Diagnose client loss (determining if buyers migrated to lower-cost hubs like China or India due to price hikes). - Command the upper hand in negotiations by using data to validate that your quotes fall within standard market ranges.
Key Strategic Takeaways
1.Consolidate Footprints in Core Hubs: Brazil, the US, and Spain represent 78.6% of the market. Global exporters must prioritize long-term framework agreements with major distributors here to lock in annual baseline volumes.
2.Target High-Value Specialized Segments: German companies continue to innovate in patented fungicides and bio-pesticide formulations. High-value months (such as March) prove there is steady, premium market demand waiting to be captured.
3.Align Logistics with Seasonal Windows: According to monthly data, April through July acts as an intensive procurement window across multiple geographies. Producers should align manufacturing and ocean freight logistics ahead of these surges to avoid peak-season delays.
4.Penetrate High-Growth Emerging Regions: India, China, and Australia hold a collective 10% share but offer immense upside. Entering these spaces with smaller trial batches or tailored local regulatory packages can pave the way for high-volume expansion.
5.Provide Extended Value-Added Services: German manufacturers can differentiate themselves by offering field-trial support, chemical residue analysis, and comprehensive regulatory data dossiers to accelerate local compliance and registration approvals for their global buyers.
💡Customs Data Value Point (Vetting Premium Suppliers): Importers can execute a rigorous four-step screening process on prospective German vendors using customs intelligence:
- Export Scale: Prioritize vendors maintaining an annual export volume > 5,000 tons, ensuring verified capacity stability.
- Market Footprint: Select partners exporting to more than 10 countries—specifically high-threshold regulatory zones like Brazil and the US—which proves their product compliance and quality systems are top-tier.
- Price Verification: Compare supplier quotes against historical monthly averages (e.g., USD 9,576/ton in January or USD 9,809/ton in July). A variance within ±15% indicates a reasonable market rate. Be highly cautious of abnormally low quotes, as they frequently point to quality or formulation risks.
- Consistency Tracking: Favor suppliers showing active, month-on-month export records and stable growth trends, indicating continuous business operations and healthy client retention.
Operational Tip: Prior to executing long-term agreements, request that prospective suppliers provide verified customs export screenshots covering the past 6 months (masking sensitive client data but showing volume, destination, and values) as objective proof of capabilities. This delivers concrete validation that goes far beyond self-reported capacity claims.
Conclusion
In 2025, Germany’s export landscape for HS Code 29331990 remained robust and highly resilient. Brazil, the United States, and Spain stood firm as the top three core pillars, commanding 78.6% of global export value. German manufacturers continue to leverage superior product quality and continuous technical innovation to maintain a formidable position in the global crop protection industry.
Moving forward, as global agriculture transitions toward sustainable, precise, and high-efficiency practices, Germany's pesticide products are well-positioned to deliver enduring value through superior efficacy, product safety, and environmental compatibility.