-
Home
-
China Data
- China Import and Export Data
- China Statistics Import and Export Data(CSD) China Trade Flow Import and Export Data(CTF) China Total Import and Export Data(CTD)
- China Trade Research Monthly Report(CTRMR) China Trade Research Custom-made Report(CTRCR) China Trade Research Yearly Report(CTRYR) China HS Code
-
USA & Canada Data
- USA & Canada Import and Export Data
- US Bills Export Data(USBED) US Statistics Export Data(USSED) US Trade Flow Import and Export Data(USTF) US Total Import and Export Data(USTD) Canada Importers and Exporters(CAIE)
- US Bills Import Data(USBID) US Statistics Import Data(USSID) US Importers and Exporters(USIE) Canada Trade Flow Data (CATF) Canada Total Import and Export Data(CATD)
-
Asia Data
- Asia Import and Export Data
- Indonesia Kazakhstan Sri Lanka Malaysia Philippines Afghanistan
- India South Korea Japan Thailand Jordan Taiwan & Hongkong & Macao
-
Vietnam
Pakistan
Singapore
Turkey
 Uzbekistan
Other Asia Countries
Uzbekistan
Other Asia Countries
-
Latin America Data
-
Europe & Africa & Oceania Data
- Europe & Africa & Oceania Import and Export Data
- Russia UK Georgia Norway Egypt Australia Samoa
- EU 28 Countries Moldova Azerbaijan Switzerland Botswana New zealand French Polynesia
- Ukraine Spain Belarus South Africa Morocco Fiji Other Countries
-
Market Research
-
Products
 China Data
- USA & Canada Data
- Asia Import and Export Data
- Latin America Data
- Europe & Africa & Oceania Data
- Company & Market Research
-
China Statistics Data(CSD)
China Trade Flow (CTF)
China Total Data(CTD)
China Trade Monthly Report
China Trade Yearly Report
China Trade Custom Report
China HS Code
-
US Bills Export Data(USBED)
US Bills Import Data(USBID)
US Statistics Export Data(USSED)
US Statistics Import Data(USSID)
US Trade Flow (USTF)
US Importers and Exporters(USIE)
US Total Data(USTD)
Canada Trade Flow (CATF)
Canada Importers and Exporters
Canada Total Data(CATD)
-
Indonesia
India
Vietnam
Kazakhstan
South Korea
Pakistan
Sri Lanka
Japan
Singapore
Malaysia
Thailand
Turkey
Philippines
Jordan
Uzbekistan
Afghanistan
Taiwan & Hongkong & Macao
Other Asia Countries
-
Mexico
Brazil
Venezuela
Costa Rica
Bolivia
Honduras
Argentina
Chile
Peru
Colombia
Uruguay
Paraguay
Panama
Ecuador
Nicaragua
EL Salvador
Guatemala
Other Latin America Countries
-
Russia
EU 28 Countries
Ukraine
UK
Moldova
Spain
Georgia
Azerbaijan
Belarus
Norway
Switzerland
South Africa
Egypt
Botswana
Morocco
Australia
New zealand
Fiji
Samoa
French Polynesia
Other Countries
-
Trade Tools
-
About US
-
Contact US

News
2026 Turkey Acrylic polymers Import Analysis Report
05:13 29 / 09 / 2026
Market Intelligence Report: Import Dynamics of HS 390690900000 into Türkiye
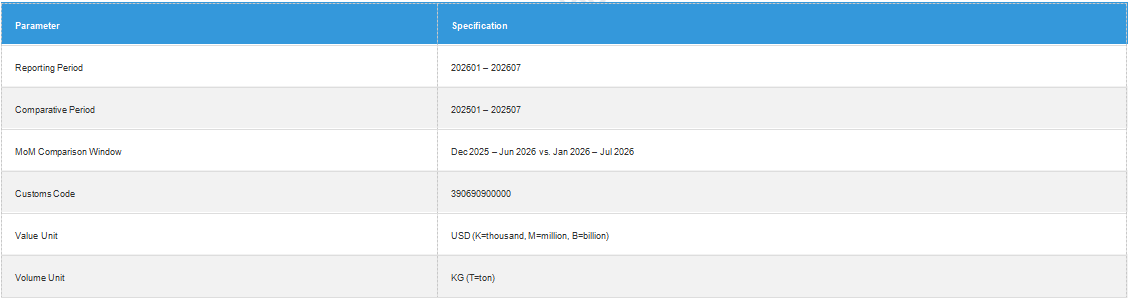
Analysis Period: January–July 2026 (with 2025 comparatives) Data Cut: Monthly series spanning 202508–202607 Unit Basis: Value in USD; Volume in KG
1. Data Description
This report examines import flows of product code 390690900000 (acrylic polymers, in primary forms – other) into Türkiye over the period January 1, 2026 – July 31, 2026, benchmarked against the same period in 2025 and against rolling month-on-month (MoM) movements.
2. Global Quantity and Price Statistics by Continent
2.1 Cumulative Transaction Distribution (Jan–Jul 2026)
2.1.1 Accumulated Transaction Value
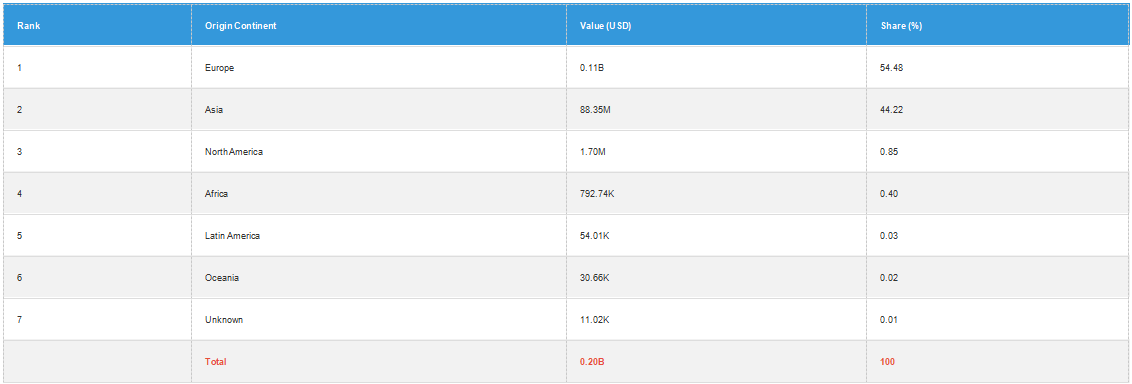
Total import value reached 0.20B USD across 57 origin markets.
2.1.2 Accumulated Transaction Quantity
Total import volume reached 0.11B KG.
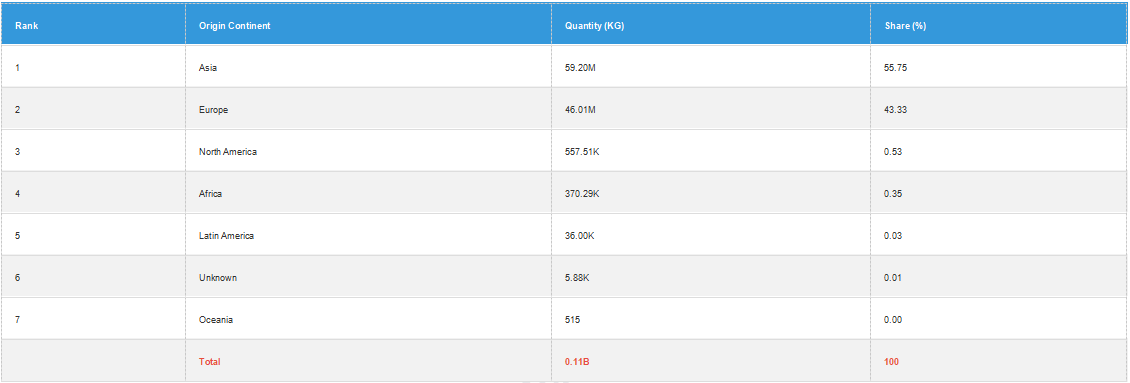
Structural Insight: Europe commands a disproportionate value share (54.48%) relative to its volume share (43.33%), implying a significantly higher unit price (≈ 2.39 USD/kg) versus Asia (≈ 1.49 USD/kg). This ~60% price premium signals premium-grade product positioning among European suppliers.
2.2 Annual Comparison of Trade Value and Volume by Continent
2.2.1 Transaction Value Growth (YoY)
2.2.2 Transaction Volume Growth (YoY)
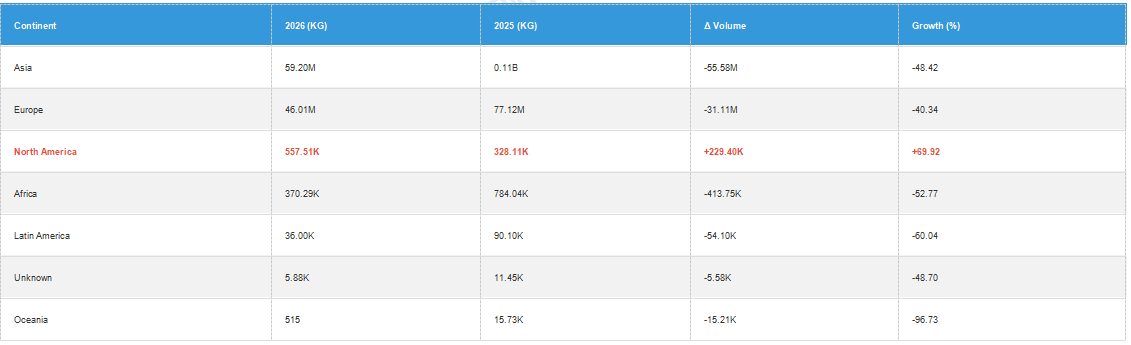
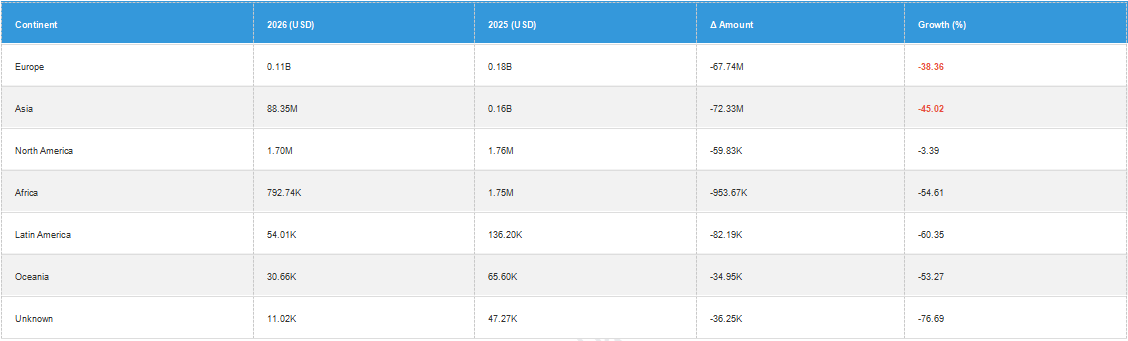
Critical Divergence: While value declined broadly, North America is the sole continent recording volume growth (+69.92%) despite a marginal value decline (-3.39%). This implies a sharp unit-price compression for North American supply — a potential volume-led, price-competitive strategy by US-origin suppliers.
3. Quantity and Price Statistics by Country of Origin
3.1 Country-Level Trade Value, Volume, and Annual Growth
3.1.1 Value by Country of Origin (Jan–Jul 2026)
Total value 0.20B USD, up +27.39M (+15.89%) YoY — a notable countertrend to the customs-code-level decline reported in Section 4, suggesting a statistical reporting scope difference or expanded origin penetration.
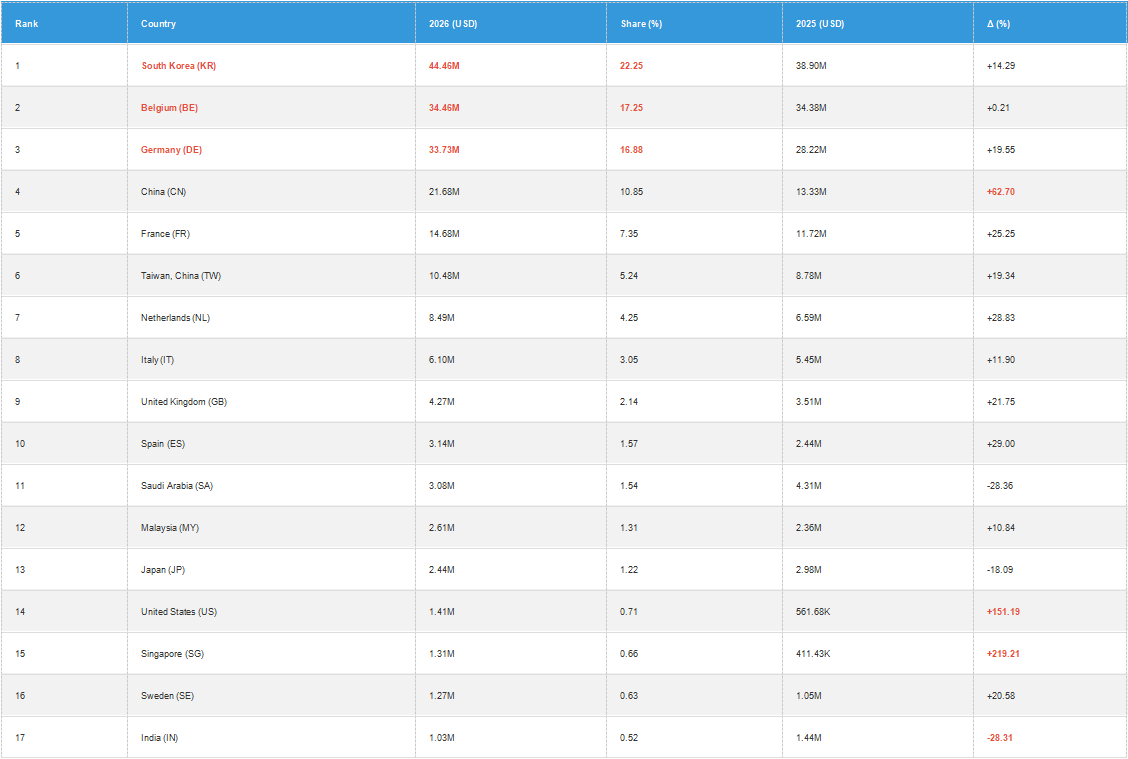

Notable Outliers:
·Singapore (+219%), United States (+151%), Iran (+147%), Norway (+330%) display breakout growth
·UAE (-91.6%) and Saudi Arabia (-28.4%) show dramatic retreat, potentially reflecting a re-routing of petrochemical derivatives trade
3.1.2 Volume by Country of Origin
Total volume 0.11B KG, up +9.30M (+9.60%) YoY.
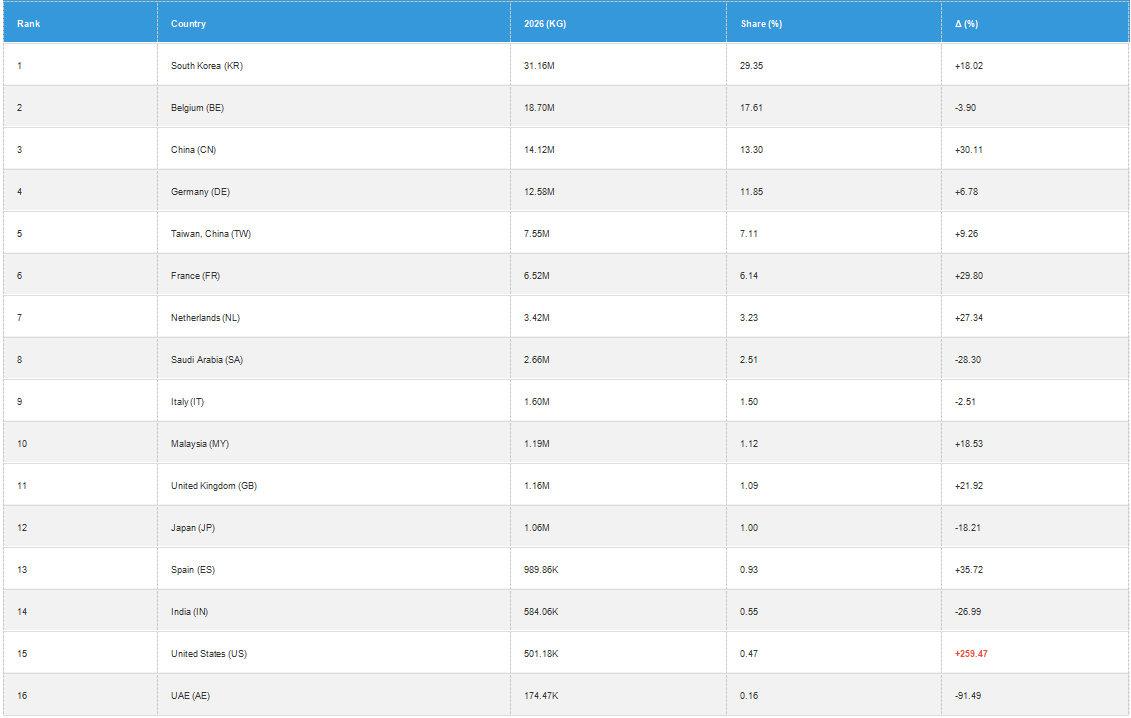
Unit-Price Signal: China imports at ~1.54 USD/kg vs. South Korea at ~1.43 USD/kg and Germany at ~2.68 USD/kg. Germany captures a ~75% price premium over China — an indicator of differentiated product specifications.
3.2 Monthly Trend of Trade Value by Top Country (USD)
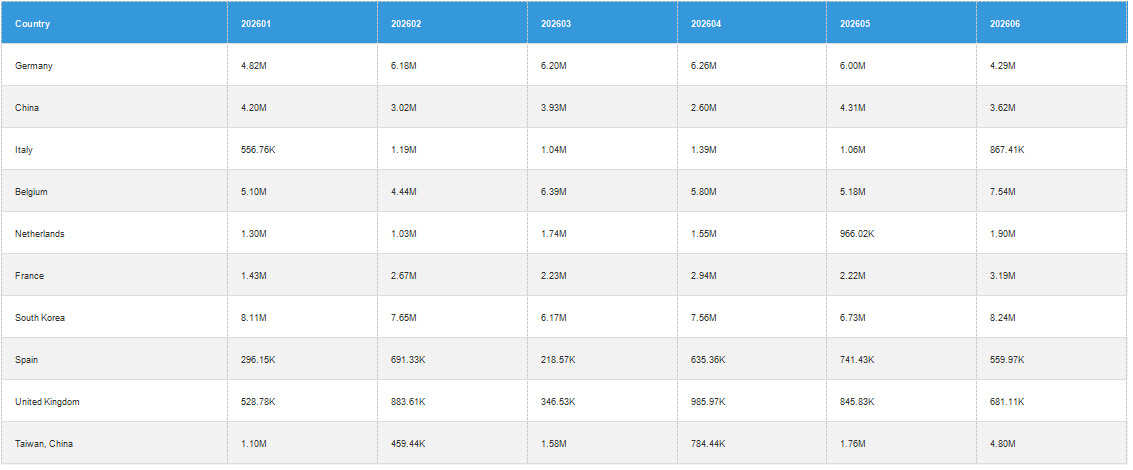
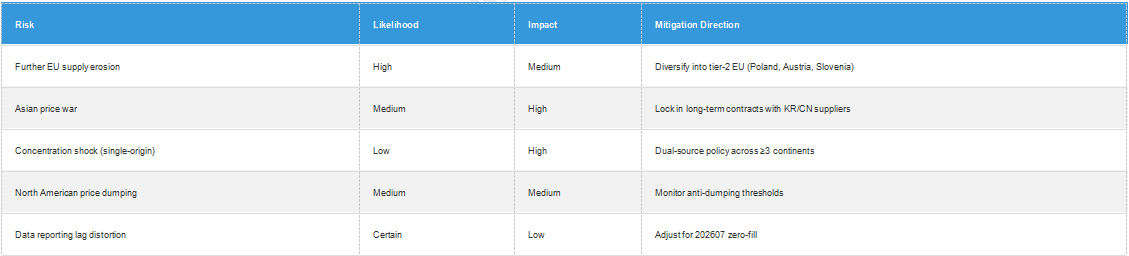
Observation: Data is uniformly zero for 202607 across all origins, indicating a reporting-lag artifact rather than an actual trade halt. Monthly flow volatility is pronounced in Taiwan, China (+172.9% MoM in Jun) — indicating order-driven lumpiness.
3.3 Top 10 Countries by Value — Monthly Same-Period Comparison
South Korea (KR)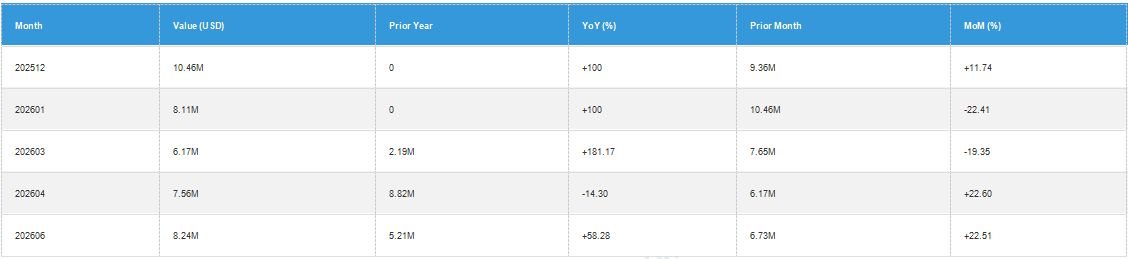
Cumulative 2026 (Jan–Jun): 90.17M vs 38.90M prior — +131.81%, with volume up +147.42%.
Germany (DE)
Trend: Peak in April followed by two consecutive monthly declines — a potential early signal of demand softening for German-origin supply.
China (CN)
Signal: Sustained double/triple-digit YoY growth confirms structural share gains.
Taiwan, China (TW)
Volatility Profile: Extreme — highest MoM swing in the dataset, suggesting single-large-order behavior.
4. Product Code Quantity and Price Statistics
4.1 Annual Transaction Value, Volume, and Growth

Note: This code-level YoY decline contradicts the country-level +15.89% value growth in Section 3.1. The discrepancy likely reflects scope differences (code-level vs. country-level universe). Analysts should treat both data sets as directional rather than additive.
Key Structural Inference: The broader -41.41% value / -45.02% volume contraction at the code level, combined with the +15.89% value growth at the country level, indicates a recomposition of supply chains — incumbents are being displaced by new-origin entrants with different pricing bands.
4.2 Monthly Trend of Coded Transaction Value

Trend: Stable $30–34M monthly baseline with a June peak of 38.62M — a +18.7% MoM jump — the strongest single-month reading in the series.
4.3 Quantity and Price Distribution by Origin
Code 390690900000 — Origin Concentration

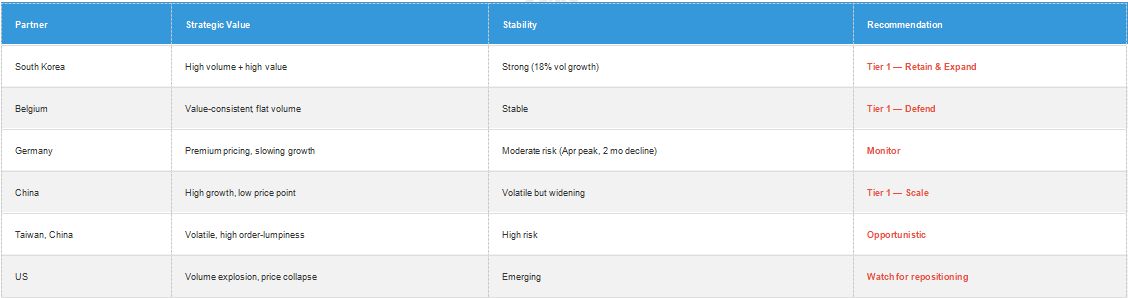
Concentration Risk: The top 3 origins control ~56% of value, creating a moderate-to-high concentration risk. Any supply disruption in South Korea, Belgium, or Germany would materially affect the market.
5. Strategic Assessment
5.1 Key Drivers Identified
1.Asian Volume Dominance + European Value Premium Asia moves 55.75% of volume but captures only 44.22% of value. Europe moves 43.33% of volume but captures 54.48% of value — a ~25% relative value uplift.
2.Structural Shift Toward New-Origin Entrants
·China (+62.7% value, +30.1% volume)
·US (+151.2% value, +259.5% volume)
·Singapore (+219.2% value, +272.2% volume)
·Norway (+330.5% value, +306.0% volume)
These reflect a rotation away from legacy Middle East suppliers (UAE -91.6%, Saudi Arabia -28.4%).
3.Price Compression in North America Volume +69.92% with value -3.39% = unit price decline of ~43%. This signals aggressive price-led market entry.
4.Volatile Order Patterns Monthly coefficients of variation are extreme for Taiwan, China (CV ~85%), Spain, and Singapore — indicating spot-order rather than contract-based trade flows.
5.2 Structural Changes

5.3 Partnership Evaluation
6. Forecast and Recommendations
6.1 Short-term Forecast (H2 2026)
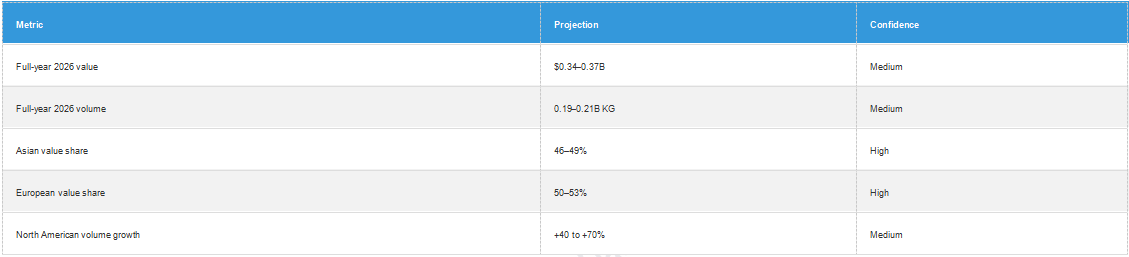 Assumption Basis: Monthly run-rate of $32–35M sustained, no macro trade shock, no currency dislocation.
6.2 Risk Matrix
6.3 Strategic Recommendations
1.Rebalance origin mix — Reduce single-origin dependency on KR/BE/DE from 56% → target ≤45% within 12 months.
2.Capture Asian growth window — Scale China and Singapore relationships while growth momentum persists (+62% and +219%).
3.Establish premium tier protection — Negotiate volume commitments with Germany and Belgium to defend the €-denominated premium product line.
4.Build early-warning system for North American pricing — If US unit price continues to compress, anticipate broader price-band disruption.
5.Introduce quarterly volatility-adjusted forecasting — Given extreme monthly CVs in TW, ES, SG, shift from annual to quarterly planning cycles.
6.Investigate UAE/Saudi withdrawal — Determine whether exit is permanent (sanctions, logistics, re-routing) or cyclical, to inform re-entry timing.
7. Conclusion
The 390690900000 import landscape into Türkiye is undergoing active structural rebalancing. While headline code-level figures show sharp YoY contraction, country-level data reveals aggressive expansion by Asian and North American new entrants and sustained premium positioning by European legacy suppliers. The market is bifurcating into a high-volume/low-price tier (Asia, US) and a low-volume/high-price tier (EU) — with South Korea uniquely straddling both.
Strategic priority: Lock in supply resilience across ≥3 continents, exploit Asian growth momentum, and prepare defensive pricing strategies against emerging North American volume-based competition.